Age range
7–16
Time
Format
Who runs it
What you get
What it measures
Maths area
Tasks:
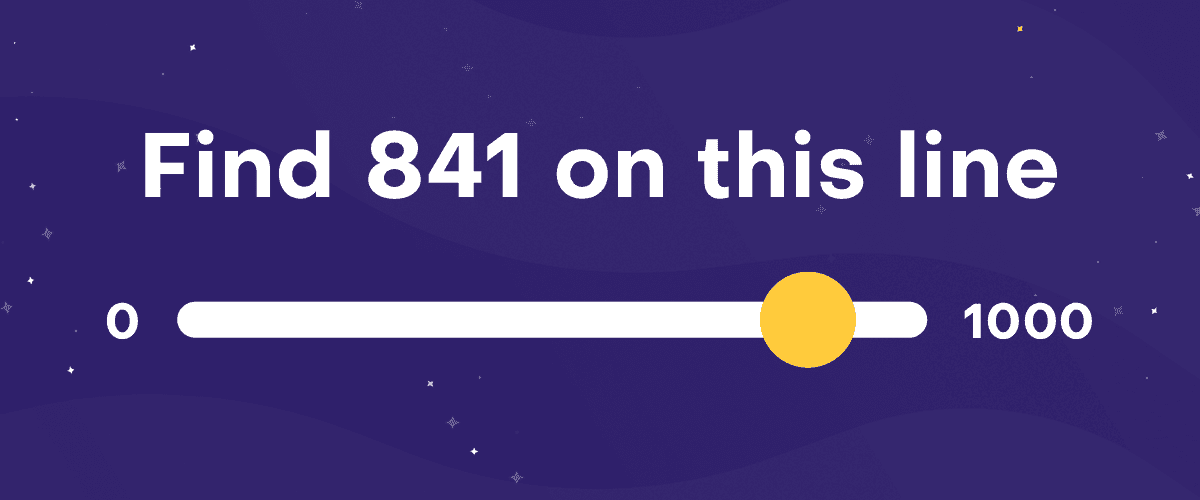
Number line
Size
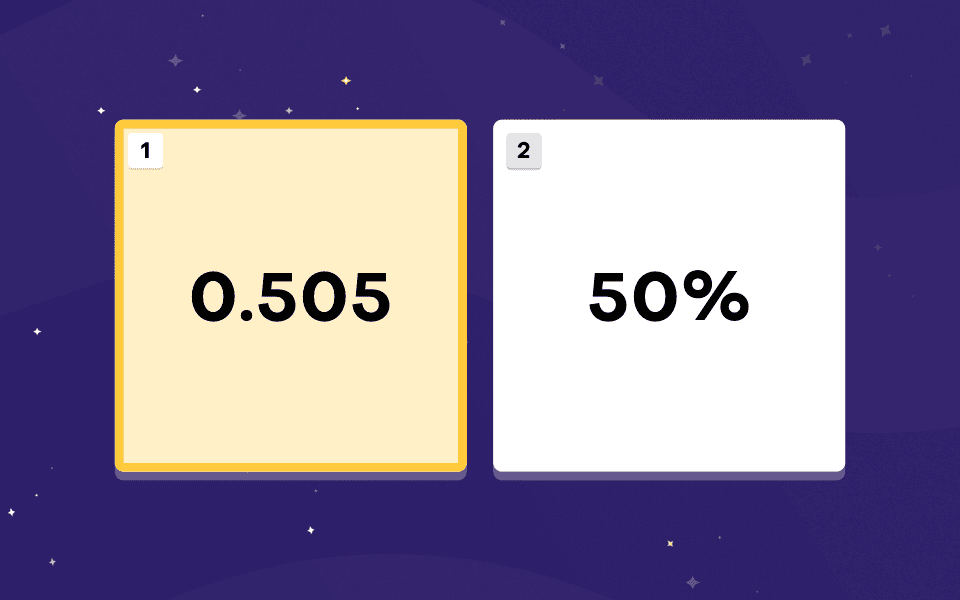
Ordering
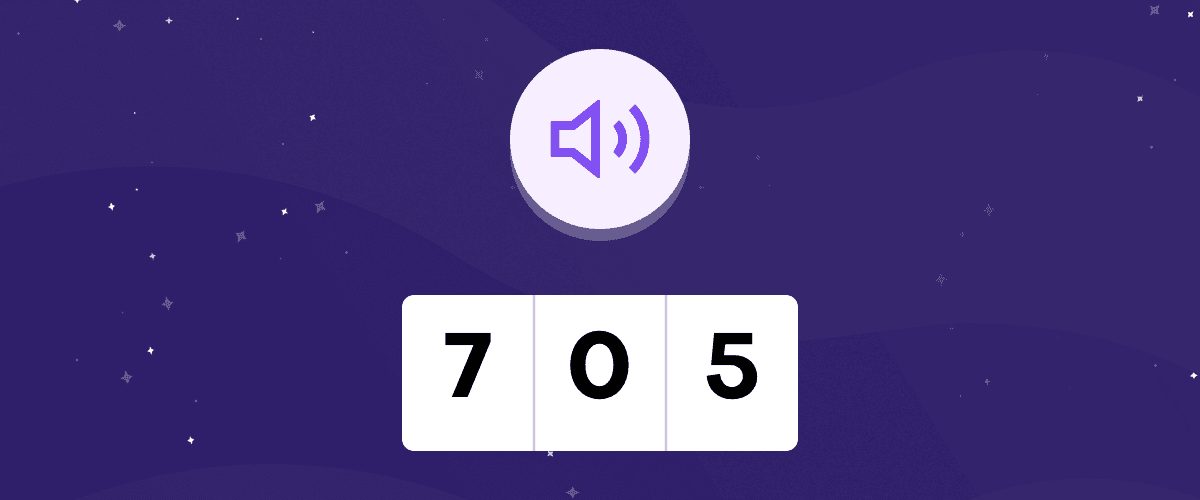
Writing numbers
Maths area
Tasks:
Counting dots
Estimating
Maths area
Tasks:
Adding
Subtracting
Multiplying
Maths area
Tasks:
Problems
Sums
Maths area
Tasks:
Language
Context
Tasks:
Memory
Numbers
Shapes
What your pupils will do
Introduction video
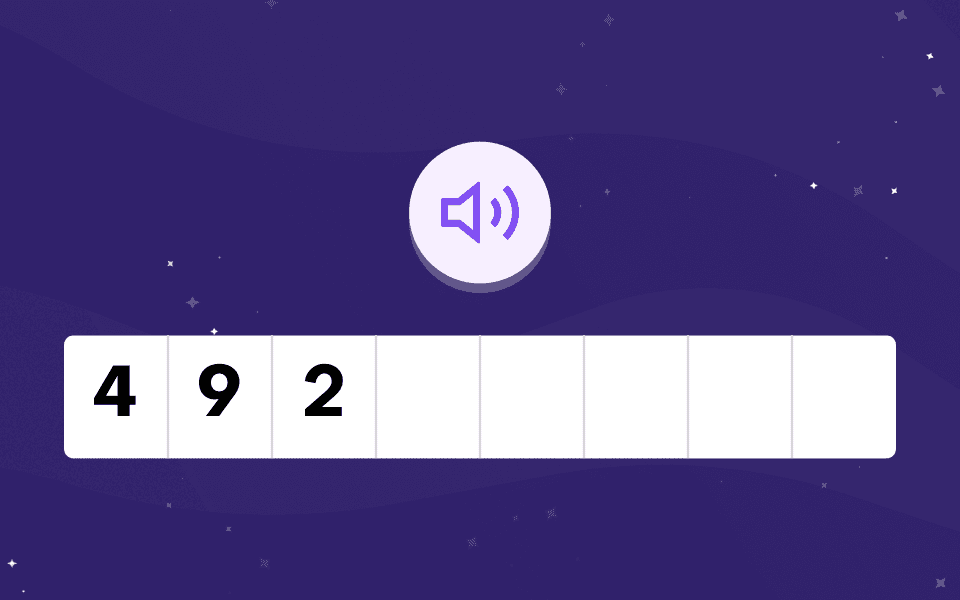
Spoken instructions
Practice with feedback
Resume later
How a session starts


1
Pupils type their own 8‑character Login ID


2
They press Start when they’re ready


3
They choose Numbers, the name pupils see for this assessment
Task by task
Grouped by the maths area each task feeds into. Each card shows the task’s name, its formal name where different, and what it measures. The processing-speed task is also called Numbers, the name pupils see for the whole assessment.
Number understanding
Maths area · 4 tasks






Quantity understanding
Maths area · 2 tasks


Arithmetic fluency
Maths area · 3 tasks


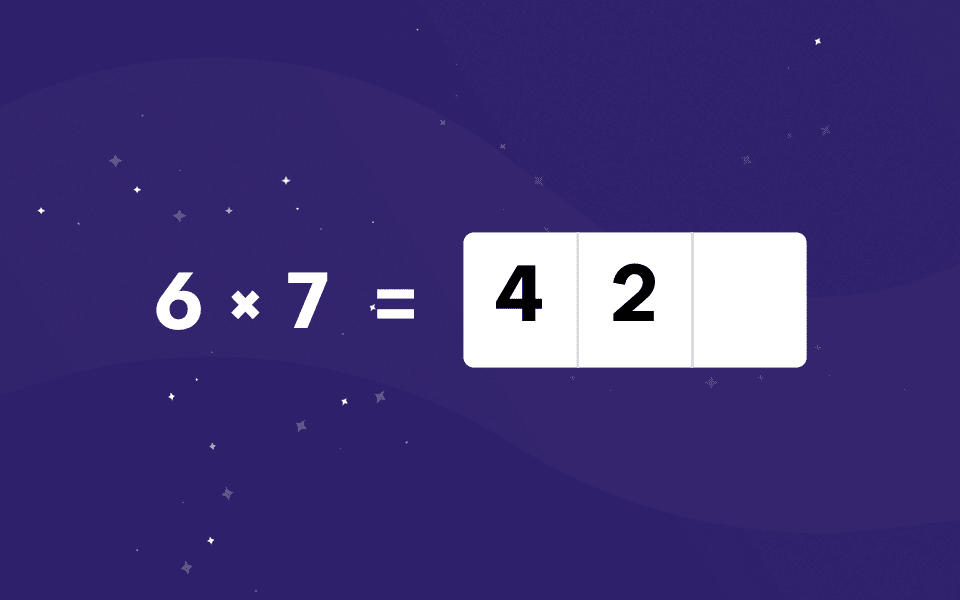
Applying maths
Maths area · 2 tasks


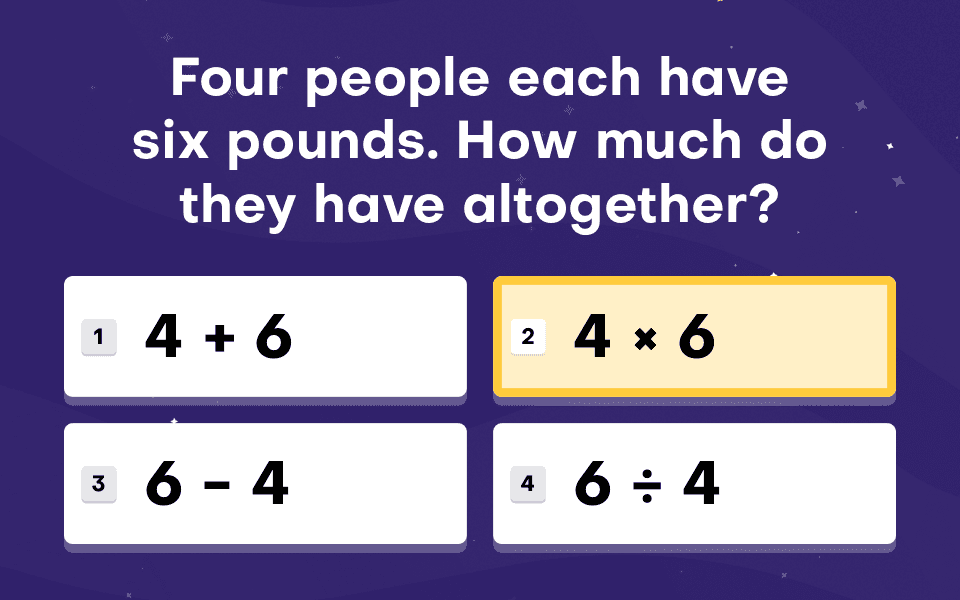
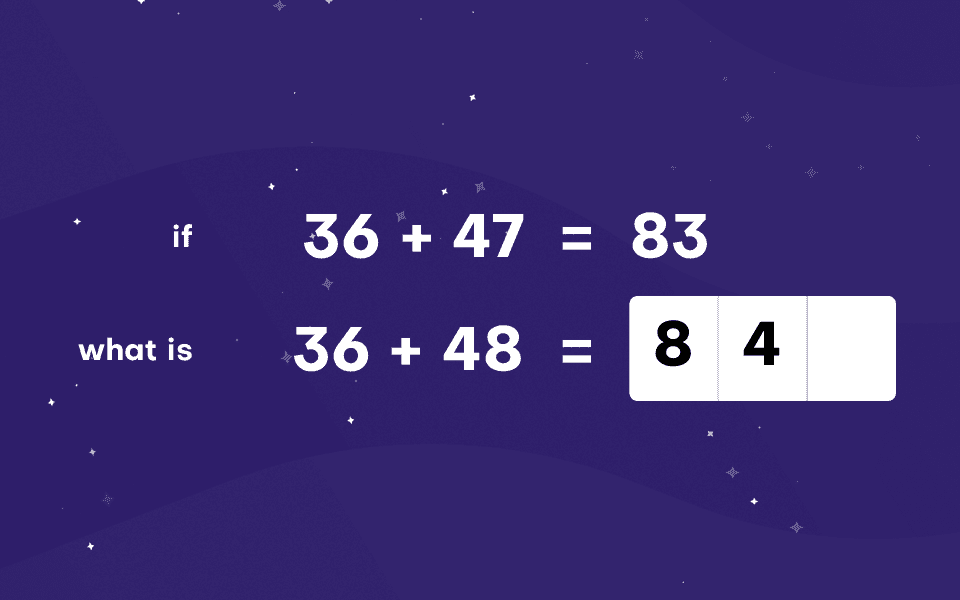
Maths vocabulary
Maths area · 1 task

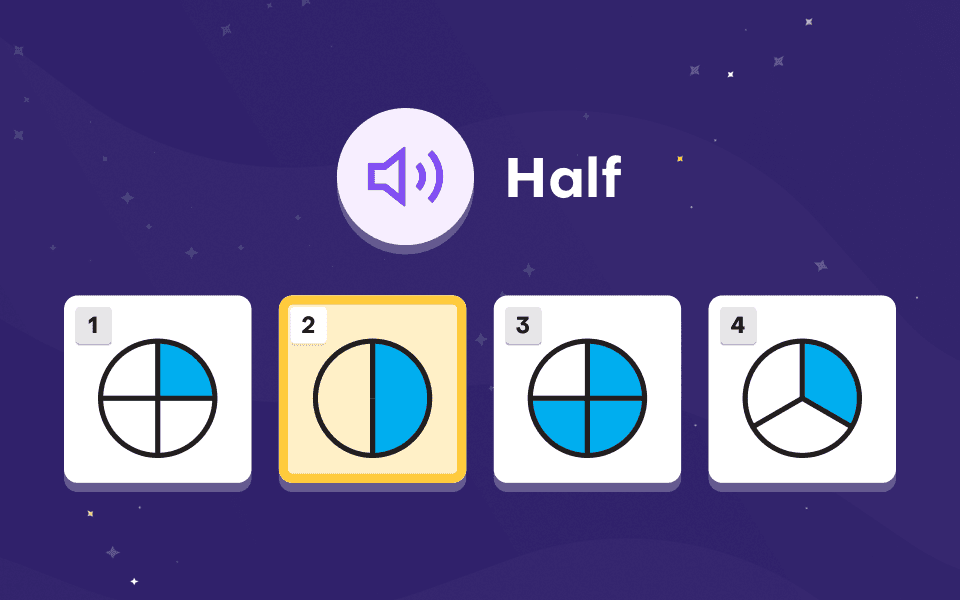
Thinking skills
Cognitive context · 3 tasks




What you get



Use the arrows to look through four parts of Logan Roberts’ sample report. Logan is a fictional secondary pupil.
1
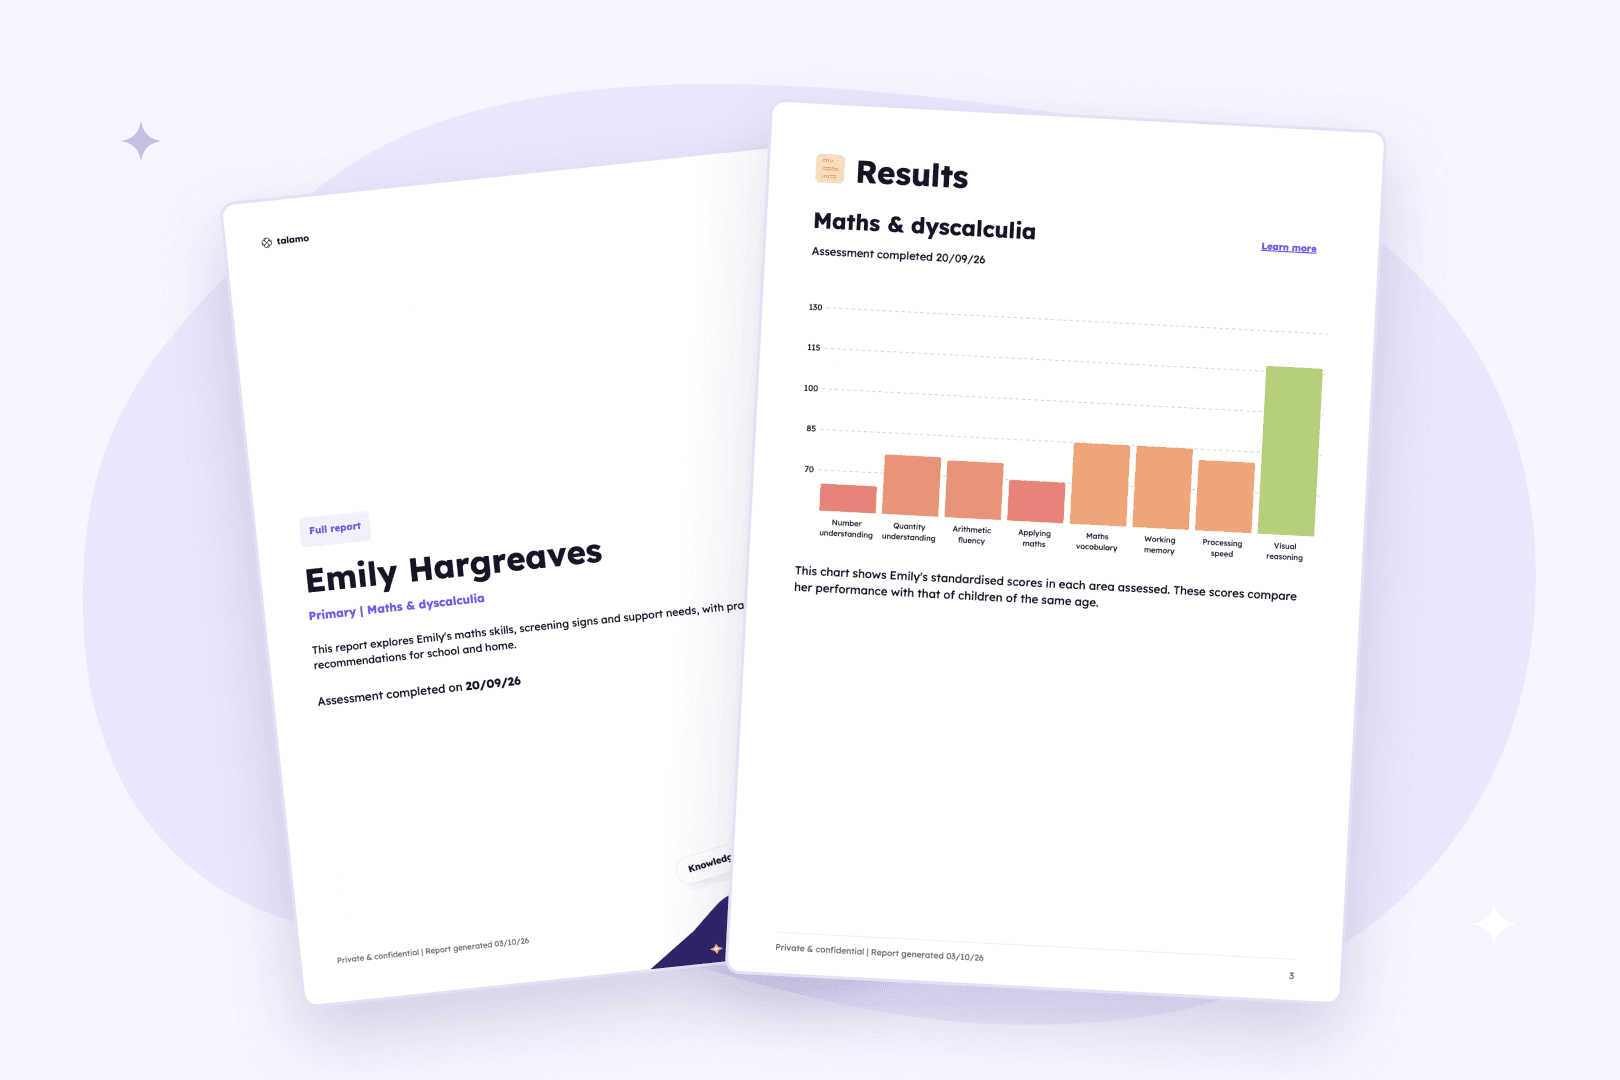
Results
His scores in the five maths areas and three thinking skills, compared with pupils of the same age.
2
Insights
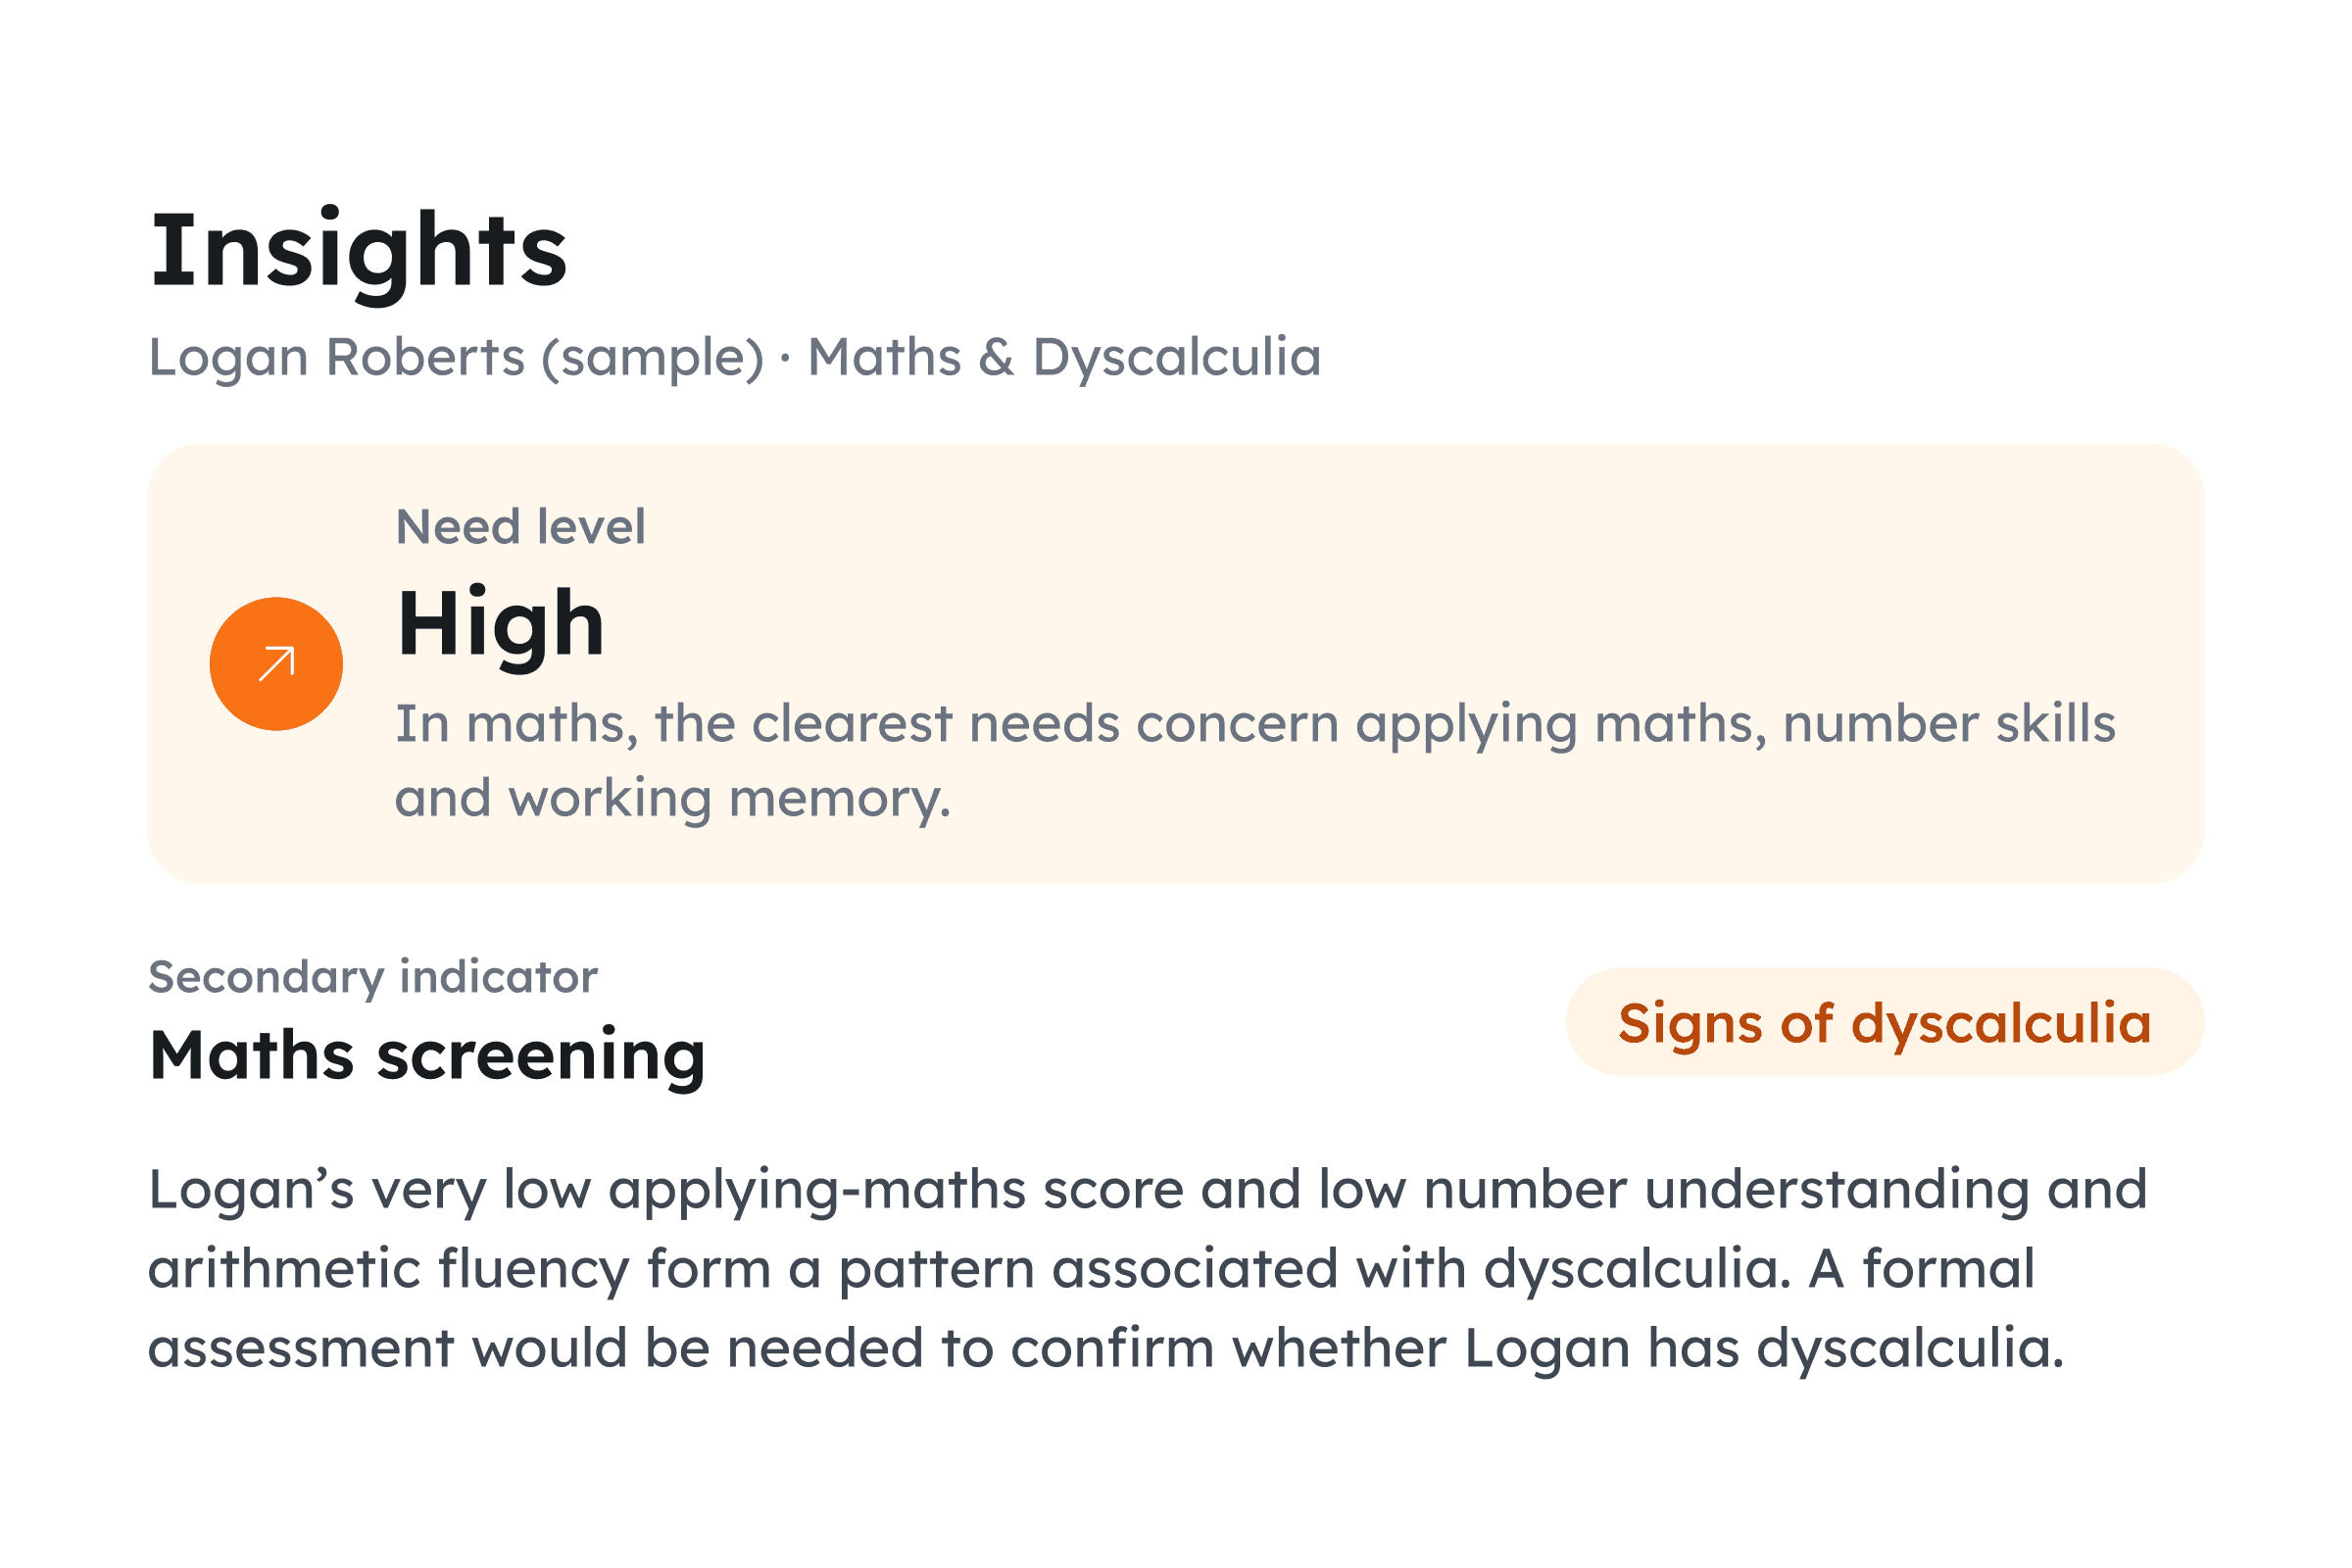
His Level of Need and maths screening result, each explained in a few plain sentences.
3
Scores
4
How to support
Practical next steps matched to his profile and year group. Use the tabs to switch between the classroom, extra support and home.
See Logan’s full report (PDF)
Secondary indicator
No signs of dyscalculia
Signs of dyscalculia
Inconclusive
Inconclusive never means no signs. A retest is recommended.
Low
Medium
High
Very high
Compare all three tests
Built into every report
Checked by a person
Every report is reviewed by Talamo before release, normally within 48 hours.
Unusual results flagged
A score far outside the typical range is flagged for review, not treated as a verdict. Check supervision, access needs and the device before arranging a retest.
Curated recommendations
Support ideas come from a curated library of strategies, selected by rules to fit each pupil’s profile.
Pupil data kept private
The AI model behind the indicator sees pseudonymised scores and context only, never a pupil’s name or other identifying details. Pupil data is stored in the UK.


pupils aged 7 to 16, in 15 schools across England, make up the current norms. They are first-generation norms, and an update using a larger cohort is planned.
reliability for the twelve maths tasks in the final assessment, measured in the pilot (1.0 would mean perfectly consistent): an early, indicative estimate.
exact agreement between the Level of Need rule and human reviewers on 200 benchmark profiles. A person still checks every report.
Built with Janet Goring
The maths tasks were built with Janet Goring, an expert in maths difficulties and dyscalculia. Fourteen were piloted with 333 pupils in 12 schools between November 2025 and April 2026, and twelve made the final assessment. Before launch, Janet reworked Sums to focus on applying known facts rather than following patterns.
Grounded in research
Number-line estimation and comparing numbers are among the most consistently replicated markers of dyscalculia, and difficulty recognising small amounts quickly is another. Numbers Reversed and Spatial Relations are adapted from the Woodcock-Johnson IV, developed in partnership with its publisher, Riverside Insights.

Good to know
Does a low maths score mean dyscalculia?
Why does the report say “signs” rather than giving a risk level?
Why do some tasks end early?
What should we do after a “Signs of dyscalculia” result?

Talk to our team
Logan’s report
Sample report · Maths & Dyscalculia
Dyscalculia
Signs
Number sense
Low
Maths vocabulary
Average
Book a call
With our team